Visit project site at http://vehicle-aging.herokuapp.com
Part 3: What Makes A Used Car Desirable?
Python (BeautifulSoup, Sci-kit Learn, Plotly Dash)
My goal here was to see if I could predict if a used car would sell quickly or not. I decided to narrow this project to a single car model in order to get past brand and model variability.
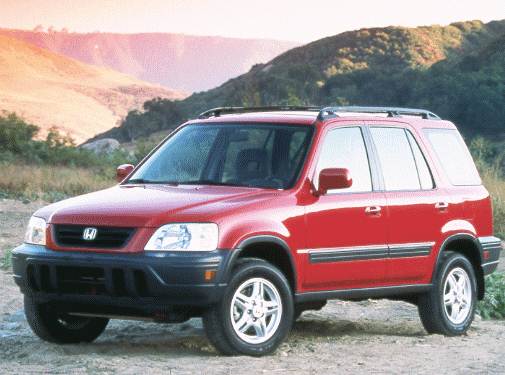
I picked the Honda CR-V as my car of focus. Why a CR-V? As one of the most popular cars in America for over 20 years, there are a ton of CR-Vs listed on used car sites. And, perhaps more honestly, I’ve been thinking about purchasing a used CR-V, and thought I could this analysis could prove useful in my search.
First, I web-scraped used CR-V listings over several weeks. I was able to keep tabs on particular CR-Vs, seeing if they were still on the market after one week.
I transformed this data into a training set. If a car was still for-sale after a week on the market, I labeled it as a ‘slow sell’. If it was not still on the market, it was a ‘fast sell’.
Next, I assembled several features. Some, like price, mileage, and model year, were taken directly from my scraped data. Some I had to engineer further, such as a ‘Percent Deviation from Model Year’s Avg. Price’ and ‘Rare Color’.
I tested several appropriate classification methods using Sci-kit Learn, including K-Nearest Neighbors, Support Vector Classification, and Logistic Regression. However, the method that returned the best F1 scores was Random Forest.
After settling on Random Forest, I used RandomizedSearchCV to tune my hyper-parameters. I was eventually able to obtain an F1 accuracy score of 0.74. This isn’t a phenomenal score, so I hope to continue to collect more data with the hopes of improving it.
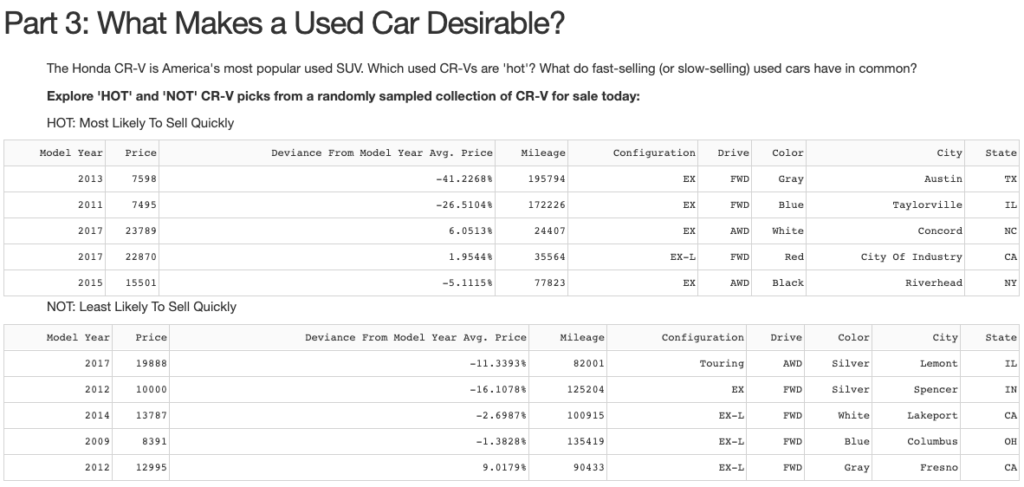
Next, I used Dash to create a dashboard that displays both ‘HOT’ (fast sell) or ‘NOT’ (slow sell) used CR-Vs. This dashboard scrapes a random sample of CR-V listings in real time, and displays those with the highest probability and lowest probability respectively, of being classified as a ‘fast sell’.


