Python (Pandas, Seaborn)
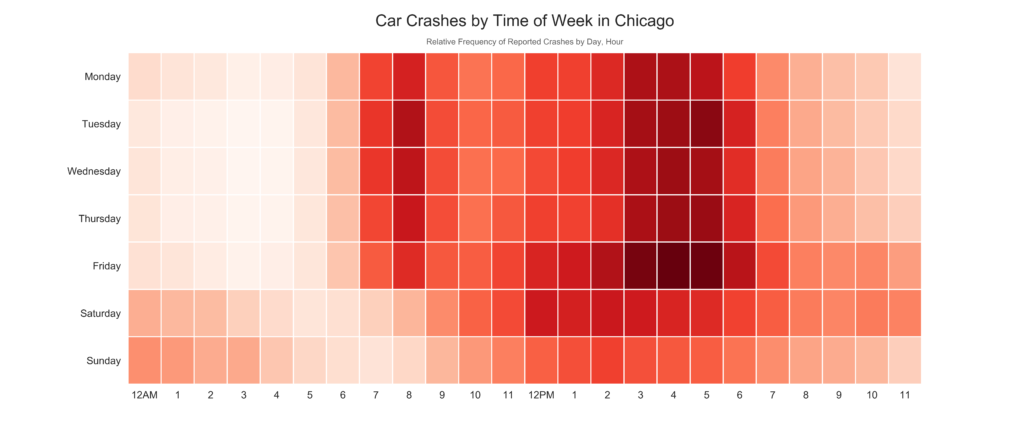
The purpose of this quick analysis was to see how time influences crash frequency in Chicago.
A secondary purpose was to try out the City of Chicago Data Portal’s API. The Chicago Data Portal is surprisingly robust and filled with many interesting datasets — I recommend it to everybody!
Another secondary purpose was to try out making heat maps with Seaborn.
The bulk of this project involved cleaning and aggregating the data, then pivoting it into the format required for heat maps. This was all done with Pandas.
Unfortunately, this graph seems mostly to be a proxy for when the most cars are on the road. I would like to reproduce this graph with relative rates instead of frequency, but I am still looking for data on number of cars on the road by hour.
One interesting outcome: Friday rush hours appear to be more dangerous than other rush hours.
This analysis is meant to be a prelude to a more intensive analysis of crashes in Chicago. I also plan to examine the impacts of holiday weekends, inclement weather, and location on crash frequency, so don’t forget to check out this page again in a couple weeks!
